Hackathon puts Biodiversity on the Map
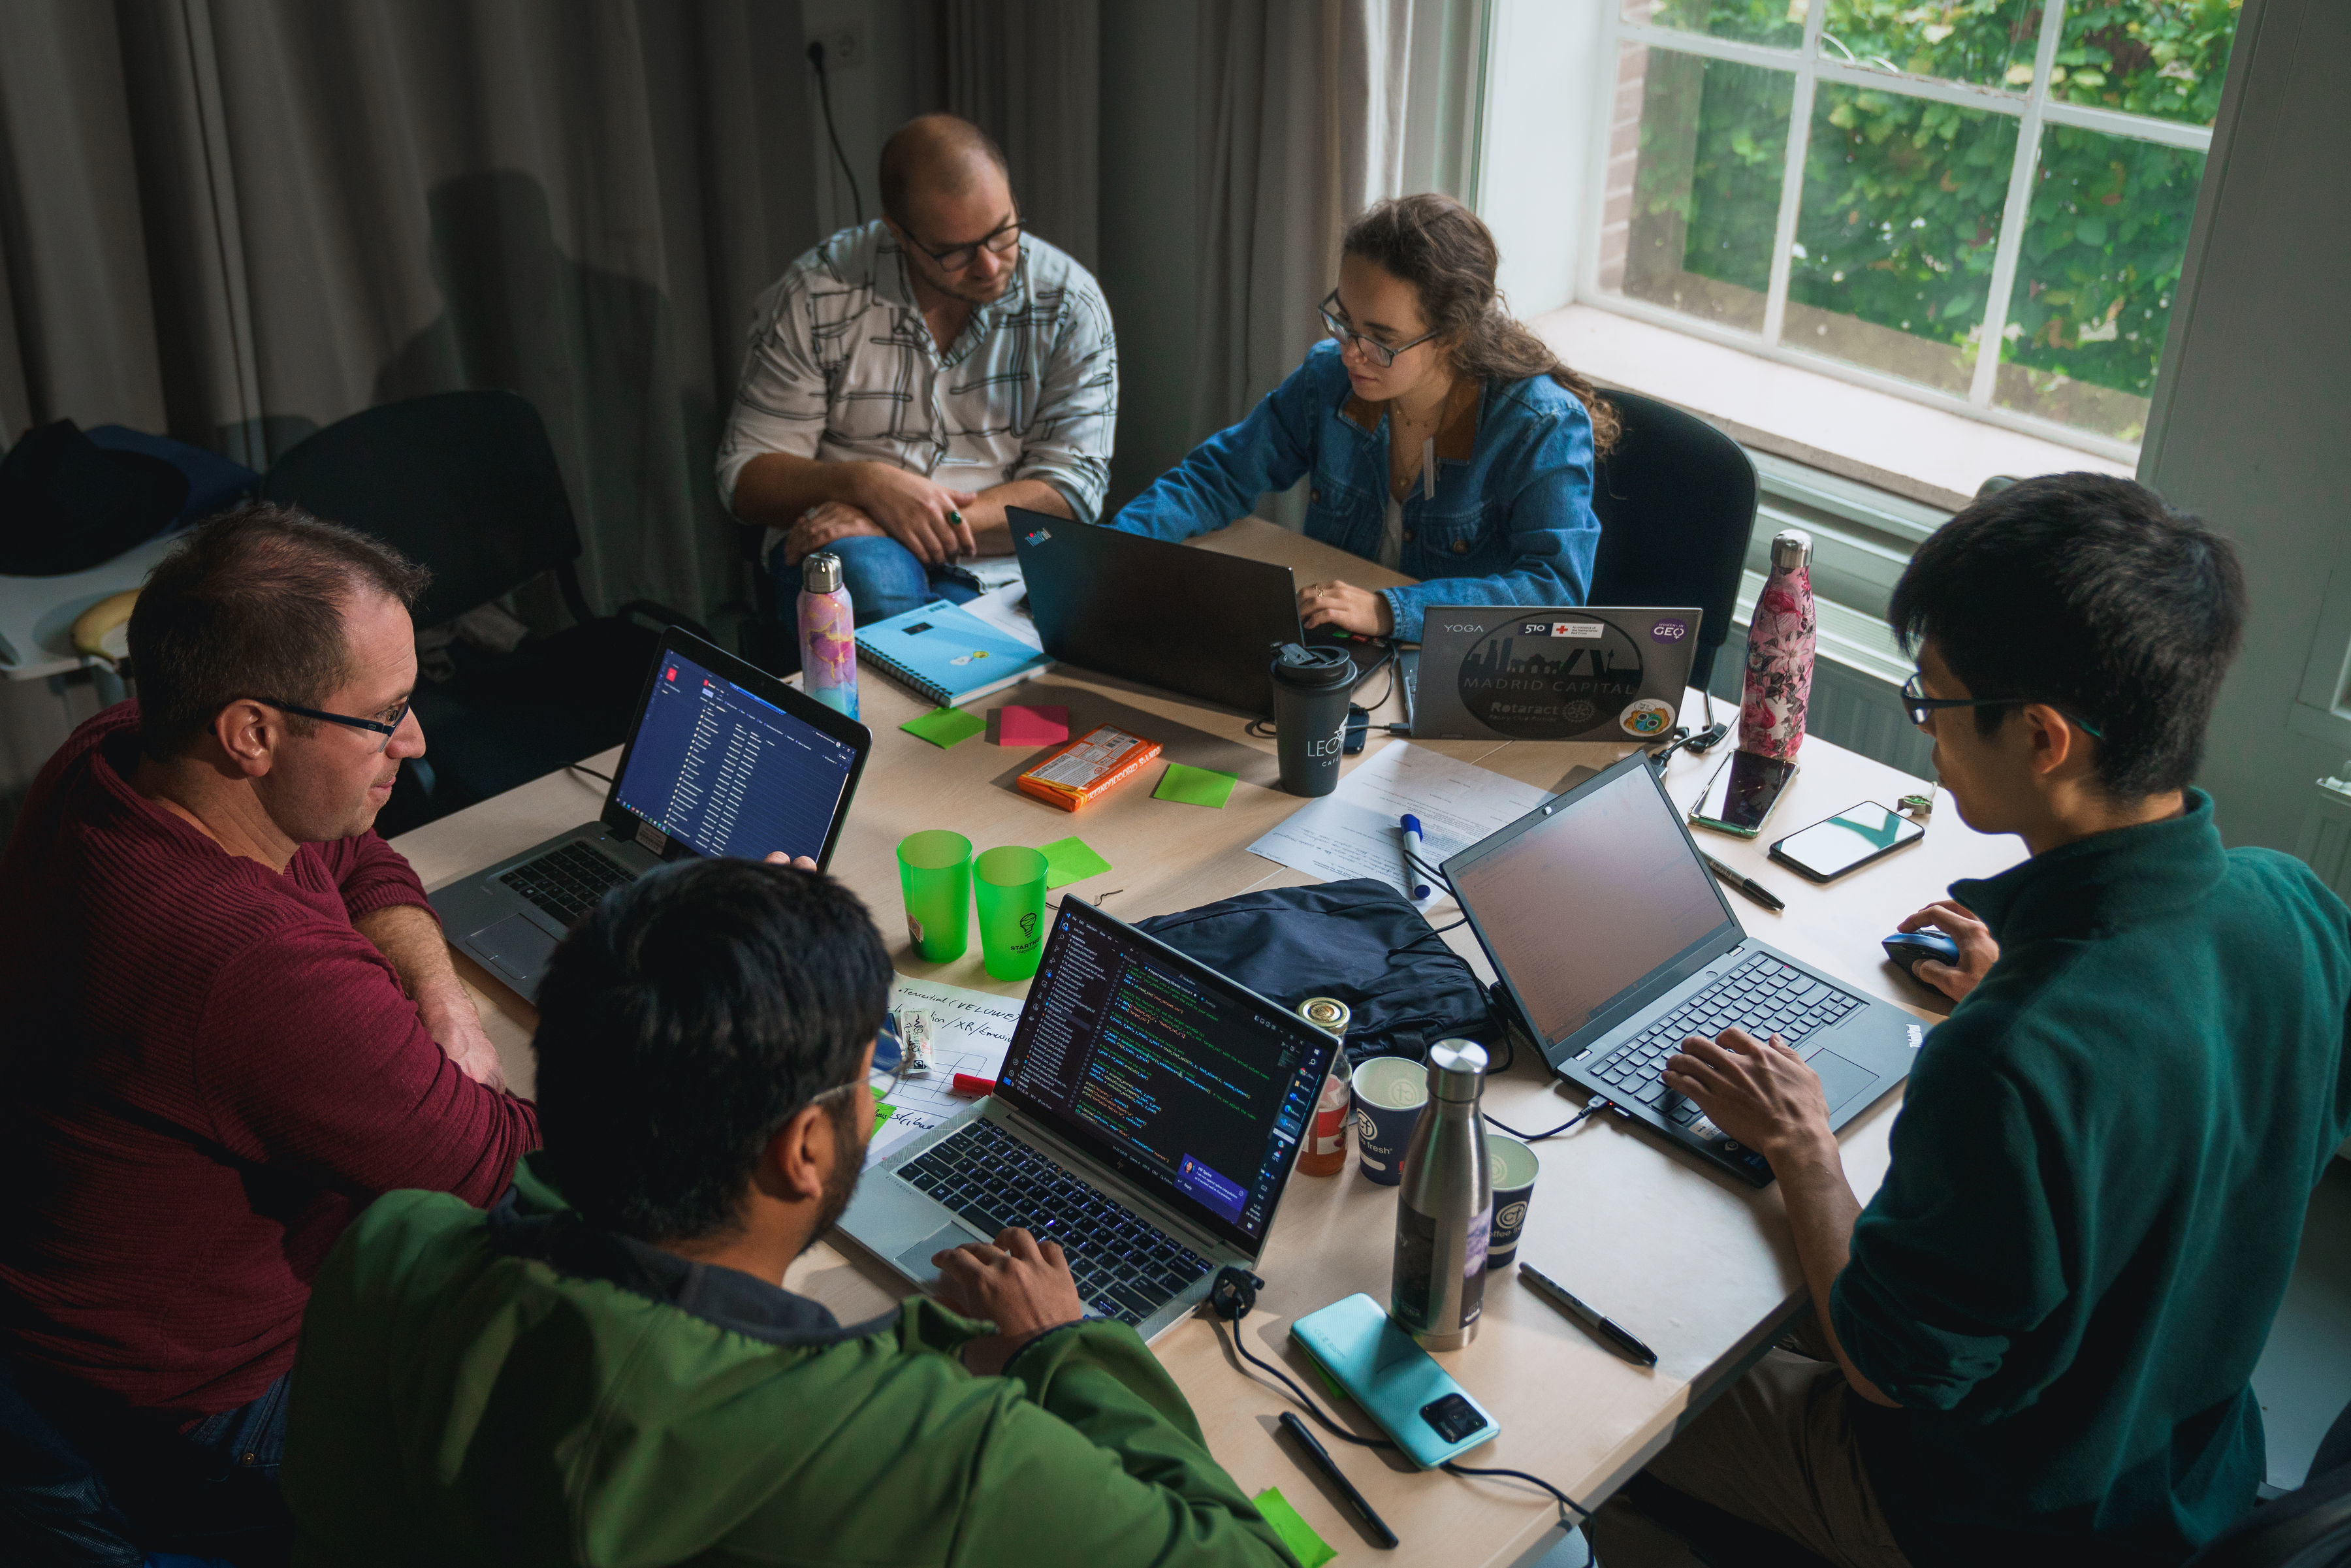
How can we use big data smartly to restore biodiversity? Five teams of experts, engineers, students and researchers pondered this question for 48 hours in the form of a Spatial Data for Biodiversity Hackathon held on 23-24 October 2023 at Ede, the Netherlands. The hackathon was a cooperation between Wageningen University and Research, the Netherlands Space Office, Deltares, Starthub and Eurisy. The event allowed the teams to dive into the data for two uninterrupted days. The detective work not only yielded new insights about biodiversity in the Netherlands, but also demonstrated what role satellite imagery and AI can play in this field.
Spatial Data for Biodiversity
“The idea for this hackathon came about through our project on mapping multiple stressors on land and sea (MOLAS) where we were dealing with many data sets representing stress factors for biodiverstity in different ecosystems in the Netherlands”, says Jenny Lazebnik, Researcher at Wageningen Environment Research and one of the organisers of the event. “Data about stressors can often come from on-site or satellite data for example changes in land use, fragmentation, tourism, water levels, temperature and particulate concentrations. These can be paired with species observations to better help us understand how many stressors simultaneously impact biodiversity”.
The Hackathon was intended to use as many available spatial datasets as possible to understand the impact of cumulative stressors in three different case study areas – the North Sea, the Wadden Sea and the Veluwe. In some of these areas the main pressures detected were nitrogen deposition, fragmentation, pollution, as well as tourism.
“Our goal was to see how professionals can use these data from observation and citizen science in order to share some insights into the risks for biodiversity. The challenge of the Hackathon was to combine three different pillars – map, data and user interface – in one final product”, explains Kim Regnery, one of the Hackathon participants.
Representatives from Deltares, Wageningen Marine, the Netherlands Space Office (NSO) took the floor to illustrate innovative solutions addressing the data needs for biodiversity. “A lot of satellite data is available as open data through the Copernicus programme, we provide insights into where this data can be found. We also demonstrated how the Satellite data portal of the Netherlands can be used and made this data available”, explains Coco Antonissen, Programme Manager Space Applications at NSO. “One of the goals of NSO is to stimulate the use of satellite data, and we believe that a Hackathon like this really boosts its use”. For NSO, such events help stimulate the use of satellite data for important societal challenges, including biodiversity.
The teams were invited to participate in team building activities: drafting the social contract which would rule their work in the following days. Ice-breaking games were also used to encourage participants to talk regardless the team they were in. A sense of community rose from this exercise, despite the ongoing spirit of competition.
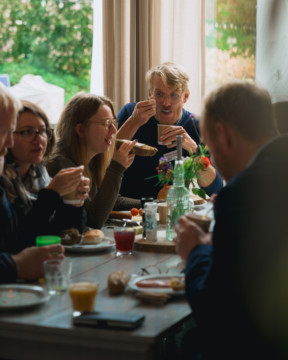
The afternoon was punctuated by work sessions and breaks, snacks and meals that were built into the programme of Akoesticum, a beautiful venue that also provided the participants with their own rooms to sleep. Although it was a short night, the teams were treated with an early breakfast on the final day.
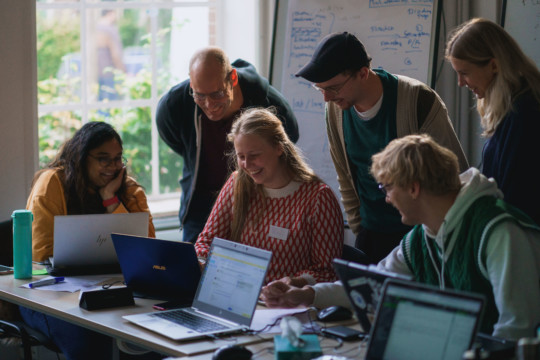
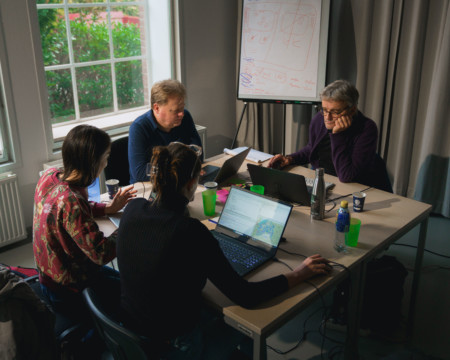
On the second day of the Hackathon, the teams presented their solutions to the jury and the participants during a pitching session. The teams offered different solutions designed to facilitate decision-making processes on monitoring and preserving biodiversity with the help of spatial data and AI. These presented pitches and the teams themselves were very diverse:
-
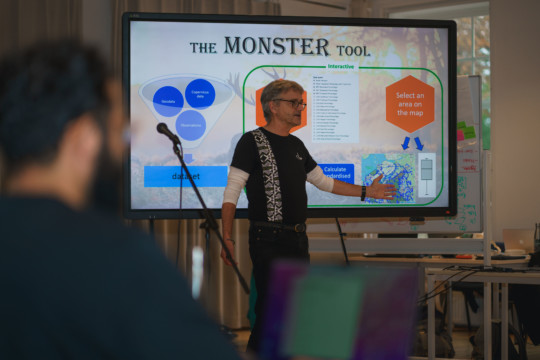
The Fallowship: Stressors for biodiversity
Fallow, an English synonym for Veluwe region in the Netherland, was taken as a basis for the team name. This team developed a tool to visualise the factors that impact on biodiversity in the Veluwe case study area. The tool provides a visualisation of relationship between biodiversity (species density) and stressors (climate, management, land use…) with an underlying data-driven relationship model. “This information can be used by policymakers and ecologists to make the effect of stressors visible”, pitched Chiel Bakkeren, the spokesperson of the team.
-
HKV NIOS – Team ShellVision
How do you detect mussel beds in the North Sea? The team from engineering firm HKV trained an AI model to detect mussel beds on aerial photographs, which would simplify data collection in the future. The team addressed the challenge of how to map shellfish more efficiently, quantify hydrodynamic stressors and predict sea level rises.
“Our goal was to make an optimal use of the data, by combining an AI model and a physical model to see the effects of the abiotic stressors on the mussels’ beds in the Wadden Sea. With our solution, we can get the location of the mussels’ beds which economise time for on-site explorations”.
The team identified 2 stressors: exposure time and waves sizes. The effects of waves, storms and air exposure during low tide were recognised as particularly important factors. Animation produced by ShellVision demonstrated how sea level rise will have a negative impact. This team also developed a way to model the impact of waves and the directions from which most waves come.
-
Komorebi – XR-based Digital Twin Systems for Biodiversity Enhancement
This team’s name means: “the light flowing through the trees”, developed a product that can visualise changes in the ecosystems with a virtual reality (VR) set and produced a scenario analysis service. The international Komorebi team sees opportunities to develop an extended reality “digital twin” based on everything that is known about an ecosystem. The aim is to model different ecosystems and thus visualise everything an ecosystem provides in terms of services. One can also use such a digital likeness of an ecosystem to test whether interventions will have a positive effect in the real world. In his presentation, Carlota Buznego spoke enthusiastically about the opportunities VR offers to make area development transparent. What does an increase in nitrogen, a decrease in biodiversity look like? With this model, one can generate pictures of different outcomes based on projected stress effects or on proposed interventions on an ecosystem or a landscape.
-
Habitat Hackers – Wadden Sea
The Habitat Hackers team elaborated predictive biodiversity maps based on deep-learning algorithm, made available to everyone through a dedicated website. Their solution demonstrates how AI can help with understanding dynamic areas such as the Wadden Sea. For example, it helps answering the question of what the effects of ferry moving on the route to Ameland would be. The impact of this change can be visualised by the model.
“We are using sentinel data, but also data from the field, gathered by researchers who make measurements and combine all this in one dataset to answer different questions. The end product that we are making is the website that has a tool embedded in it, based on an AI model that generates biodiversity maps depending on the user’s enquiry”.
-
The Pack – Multiple biodiversity stressors in the Veluwe
Land use, climate change and nitrogen emissions impact biodiversity in the Veluwe. How do these three problems affect different target species? The team combined data on different species and their preferences with a deep-learning algorithm that goes to work with the input and creates a map of where to expect these target species under the preset variables.
By the time jury retired to deliberate, participants were invited to take part in an artistic and interactive performance based on the sounds of nature and biodiversity, and the disruption caused by stressors. This was an excellent way for the teams to relax after stressful hours, while still connect with biodiversity, just from another point of view.
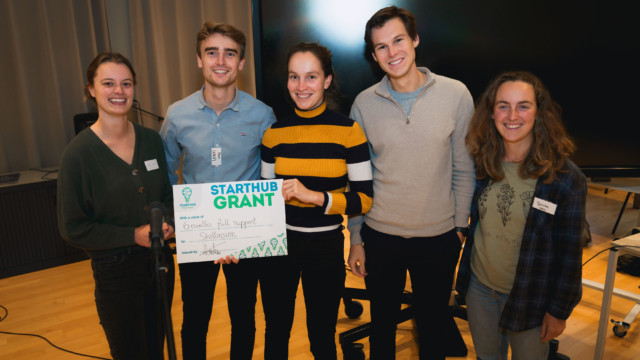
For the awarding ceremony, StartHub organised and sponsored a Public Award, allowing participants to vote for their favourite solution. The results of the ceremony were as follows:
- Public Award was granted to ShellVision, who presented a solution developed to preserve oysters and seashells in the Waddensea.
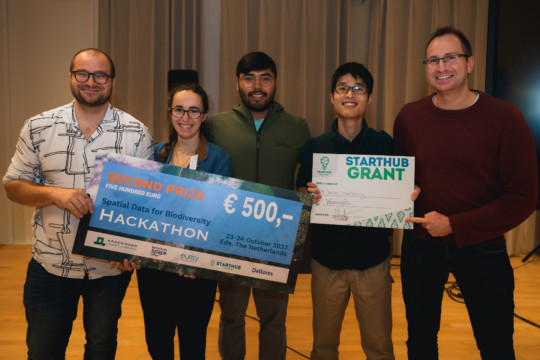
- 2nd Prize went to Komorebi, with their solution to visualise changes in the ecosystems and provide for a scenario analysis service in the Veluwe.
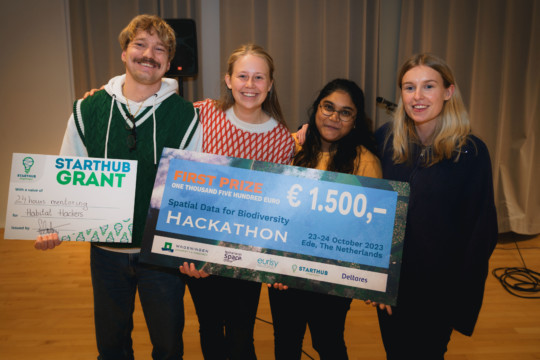
- 1st Prize was granted to the Habitat Hackers team who produced predictive biodiversity maps based on deep-learning algorithm for the Waddensea.
In the aftermath of the Hackathon, both the organizers and the participants noted that it was a perfect opportunity for networking, connecting people in an innovative environment with a spirit of healthy competition. Many of them took inspiration to organize and participate in similar events in the future, perceiving a hackathon as an incubator for new ideas.
About the organisers
The Hackathon was a result of collaboration between several partners. Wageningen University and Research, with its mission to realize high quality and sustainable green living environment; StartHub Wageningen, an incubator and educator for students, PhD and recent graduates of Wageningen University and Research; Deltares, an independent knowledge institute, working on innovative solutions in the fields of water and subsurface; and the Netherlands Space Office, the space agency of the government of Netherlands. The organization of the event was supported by Eurisy.
Dive into the atmosphere of innovation yourself by watching the video from the Hackathon: