Copenhagen: Rethinking the urban space by mapping air pollution
Copenhagen Solutions Lab collaborated with Google to assess air quality in the city with the support of Satellite Navigation
Copenhagen Solutions Lab
Copenhagen Solutions Lab is an internal consultancy of the Technical and Environmental Department of the Municipality of Copenhagen, in Denmark. With a staff of eight people, Copenhagen Solutions Lab works on issues of transversal interest among the City’s departments by using innovative technologies to promote green urban strategies and policies.
The challenge
Air quality is an issue that concerns several municipal departments, including those responsible for adaptation to climate change, environmental protection, transport, biodiversity, water, economic development, and, — especially — health.
Indeed, even in a clean city like Copenhagen, air pollution is identified as one of the main causes of premature deaths and it is suspected of exacerbating illnesses such as cancers, cardiovascular, respiratory and lung diseases, and even neuro-logical disorders like autism, dementia, Parkinson’s, depressions, and more
Traditionally, air quality is monitored through sensors at static stations located around the city. These provide a generic representation of air quality, and in particular its annual average, which reveals long-term trends. Nevertheless, traditional measurements are not able to deliver precise information on where and when pollutants are most present during the day and people are exposed to it.
Copenhagen Solutions Lab was looking for ways to localise air pollution at the street level and to understand when specific city spots are particularly vulnerable to this phenomenon.
The satellite solution

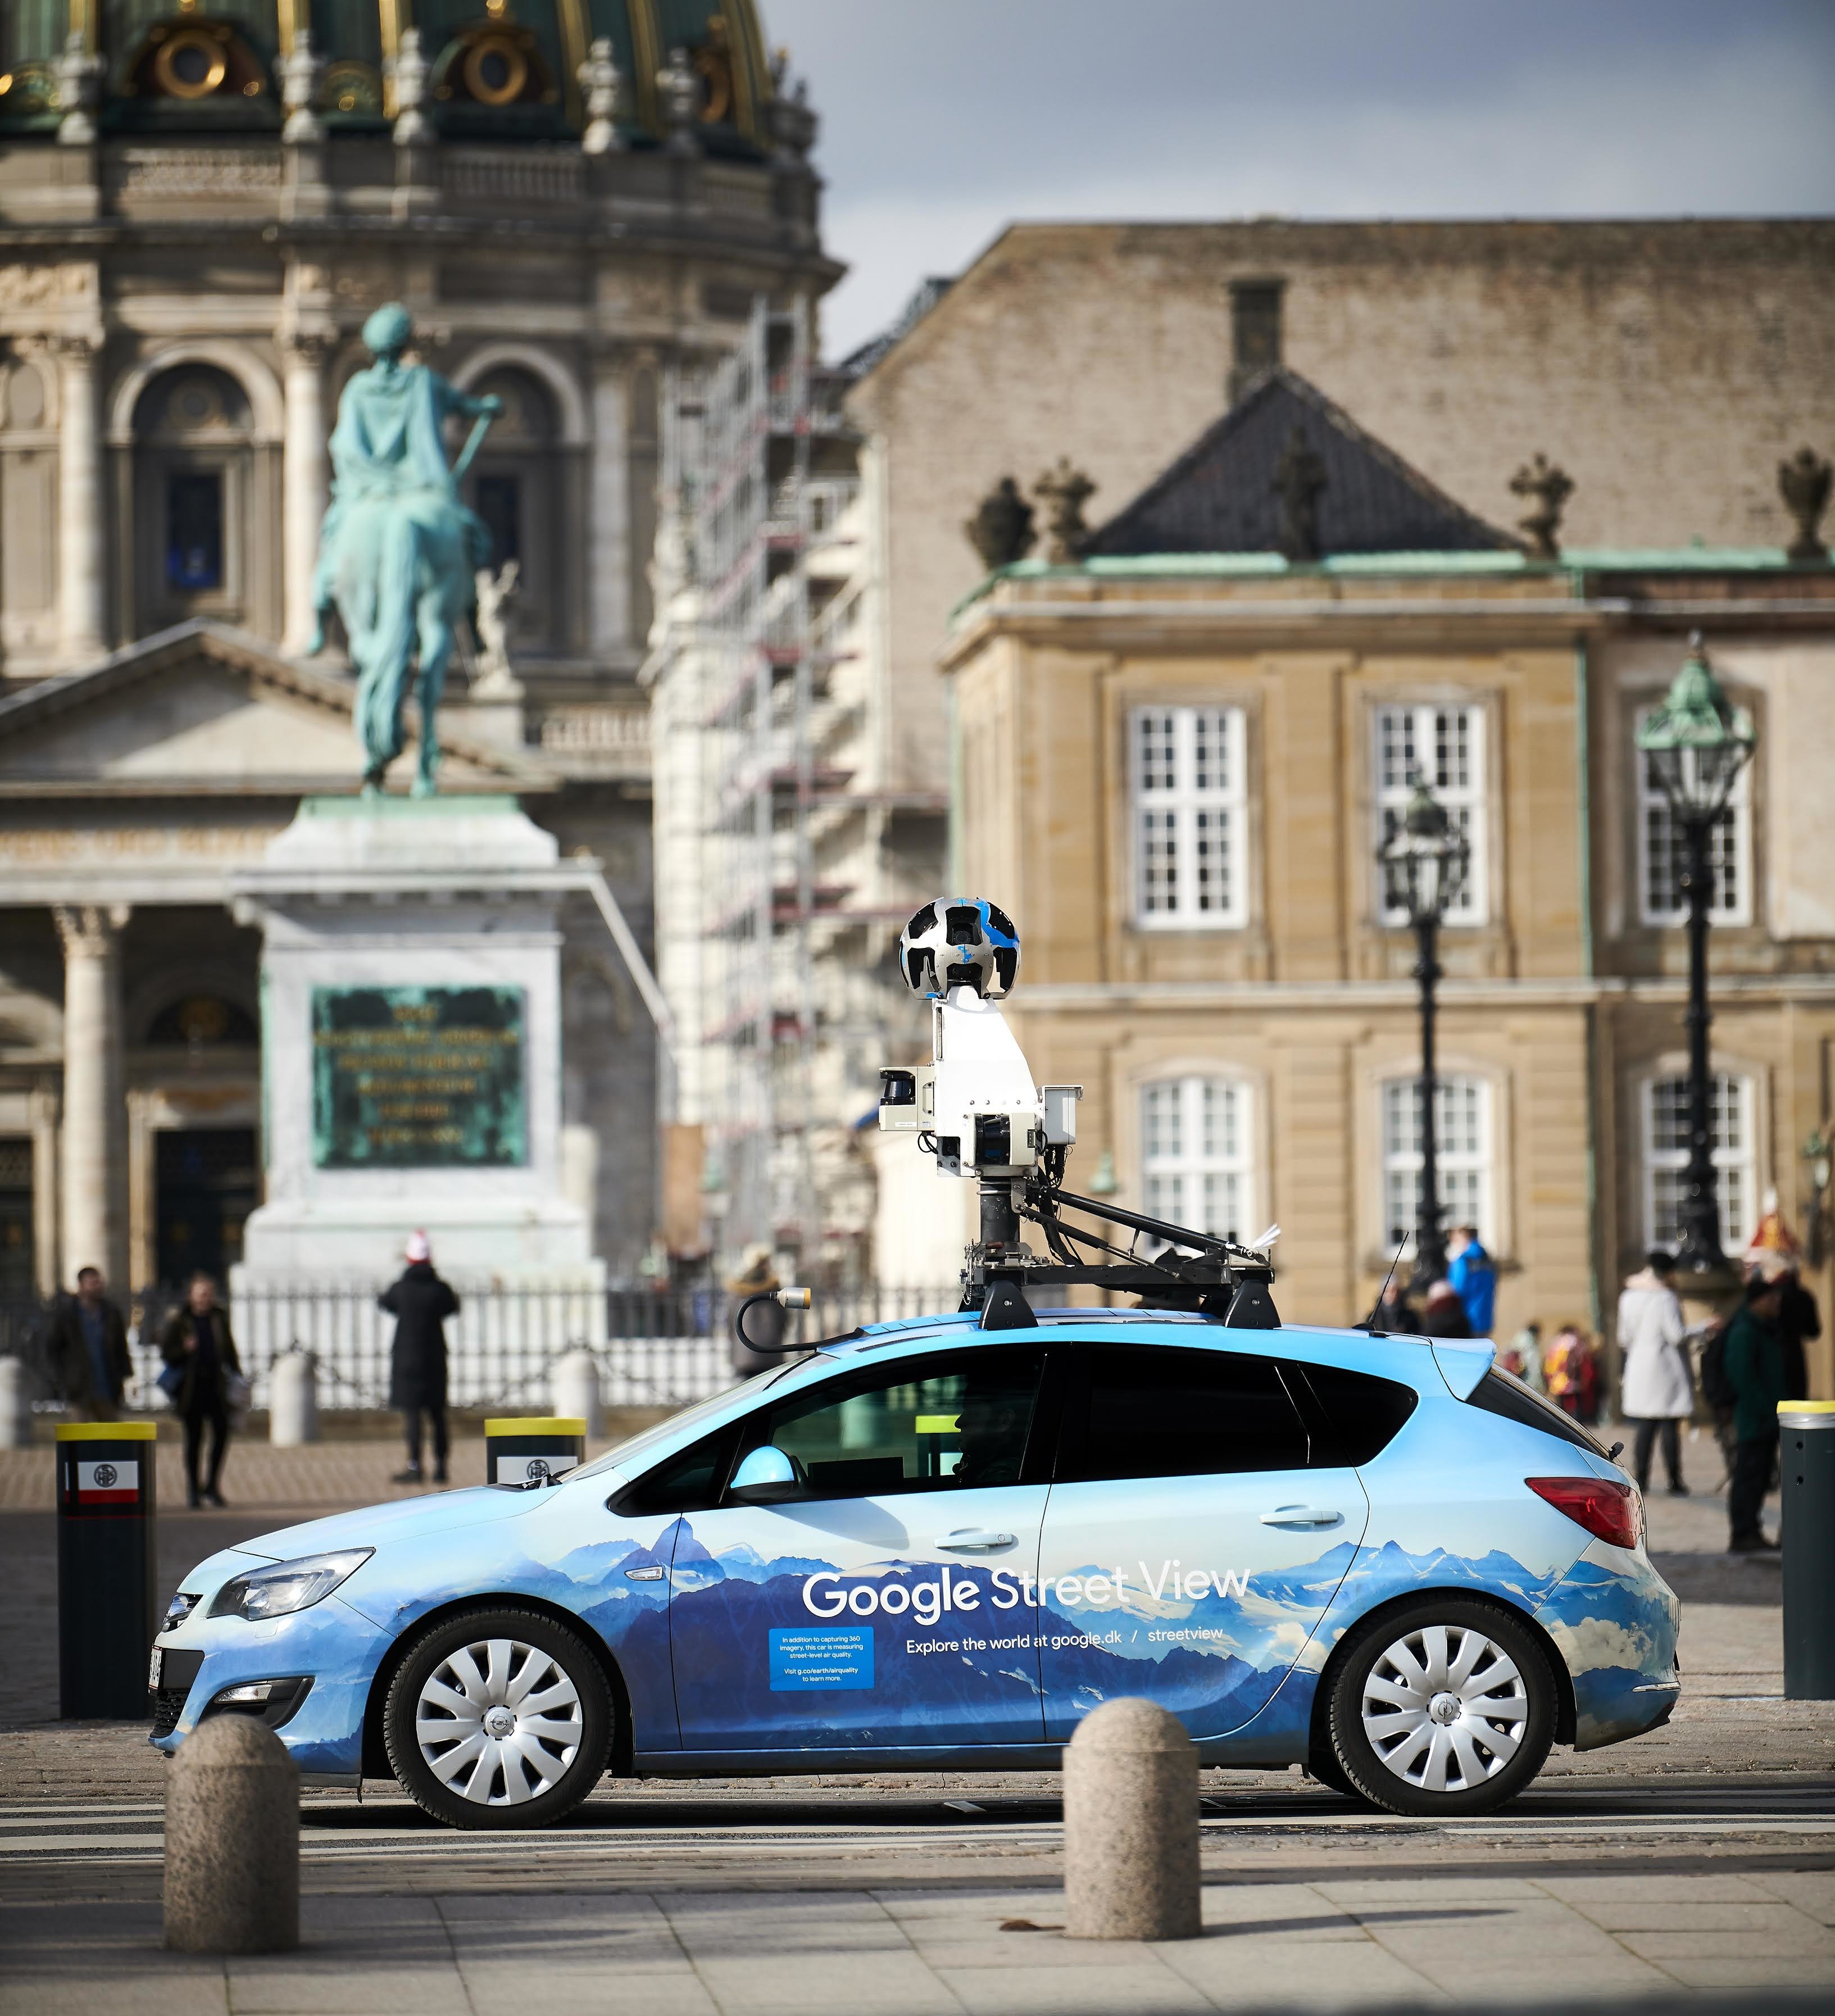
In 2017, Google offered to support the efforts of Copenhagen Solutions Lab by using the methodology developed within their Air View Project, with the help of the University of Utrecht and the University of Aarhus.
Google equipped its Street View cars with air quality sensors and collected data on air quality in every street of Copenhagen. The measurements targeted the pollutants that are emitted in the city, especially nitrogen dioxide, ultrafine particulate matter and black carbon.
The cars logged one measurement per second, collecting very granular spatial data on air quality, which could be geolocated thanks to the Satellite Navigation systems embedded in the cars. These passed on every street at least six times during one and a half year, in order to get the seasonal distribution of air pollution. This was done until March 2020, when the city lockdown caused by the COVID-19 crisis was declared in Copenhagen.
The spatial accuracy of the information collected in such a way allows for the identification of correlations between human activities, infrastructure and air pollution, according to the time of the day and the season.
The results
In October 2019, a preliminary map of air quality in Copenhagen was published and presented by the City’s Deputy Mayor at the meeting of the mayors of the C40 Cities Climate Leadership Group, that was taking place in Copenhagen.
In the same year, the project caught the attention of other local and international partners. Gehl Architects, a Copenhagen-based urban design agency, got interested in the map and decided to use it to understand how they could reduce the effects of air pollution on children by redesigning public spaces. This initiative, The Thrive Zone project, funded by the Bernard van Leer Foundation and the ICLEI Action Fund, aims at designing urban solutions to increase air quality and reduce exposure to pollution, and at involving citizens in data collection, design and in behavioural changes.
In particular, Gehl mapped childcare institutions and interviewed care workers and care givers on children’ movements in two neighbourhoods, and crossed such data with the information they had on air quality to understand how air pollution impacts on them. Afterwards, Gehl produced a “Cleaner Air Network” map, indicating the areas where air quality is better and where children could spend more time, suggesting urban design interventions.
The final map of Copenhagen’s air quality was released openly in the Spring 2021, accessible to anyone. The map allows for the identification of the most polluted areas (major inroads, airport and the city centre) for the different pollutants, i.e. nitrogen dioxide, ultrafine particulates and black carbon. The map aims at serving all departments of the City’s administration, by putting air quality at the core of city policies.
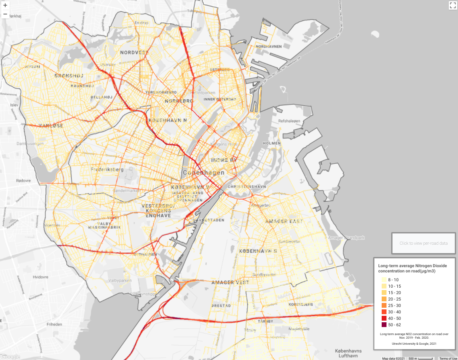
Copenhagen AirView NO2
The dataset and the model to use it are made available to support urban policies aimed at reducing the exposure to pollution, especially for the most vulnerable groups. Meanwhile, the Thrive Zone project continues to test how implementation can happen in existing urban areas and document effects in real life settings, e.g. by using bushes and trees to contrast fine particles, or by building spaces for children and the elderly where air quality is higher) and to make residents less exposed to pollution by changing their behaviour (i.e. by spending less time in polluted areas).
“By making scientific data available to citizens, we have the potential to make global challenges relevant at the local scale”, Rasmus Reeh, Copenhagen Solutions Lab
