The Public Service of Wallonia (Belgium) relies on satellite imagery for a comprehensive view of land cover and use
To support regional public and private entities, the Public Service of Wallonia (PSW) produced two maps of land cover (LC) and land use (LU) based on aerial photos and satellite imagery
The Public Service of Wallonia
Wallonia is one of three regions of the federal state of Belgium, alongside Flanders and the Brussels-Capital Region. Located in the southern part of the Country, Wallonia covers 55% of Belgium and hosts one third of the Country’s population.
The Public Service of Wallonia (PSW) is in charge of implementing the policy of the Walloon region and it is the primary interface between the regional institutions and the local administrations and citizens of Wallonia. The PSW employs around 10 000 people in its central department of Namur and the decentralised departments in Wallonia and Brussels.
The challenge
In recent years, most of the competences related to territorial management in Belgium have been delegated to the governments of the three regions. This means that a number of users of geospatial data are now situated at the regional, provincial and municipal levels.
For Wallonia, the Geomatics department of the PSW is in charge of harmonising territorial data collection and distribution, and of facilitating data acquisition and use by the region’s public and private institutions. To comply with the EU INSPIRE Directive, the Team needs to acquire precise, accurate and easily updatable information, including data on land cover (LC) and land use (LU). Indeed, such data are of paramount importance for Walloon administrations, which use them for climate reporting, flood mapping, land take monitoring, forest management, agriculture planning, and land visualisation, among others.
Until 2017, the existing land cover and land use (LCLU) map of Wallonia was derived from cadastral and agricultural information but did not allow users to distinguish information on LC from information on LU.
The satellite solution
In 2017, the Public Service of Wallonia launched a project to produce new maps of LCLU for the whole regional territory based on annual aerial photos and time series of satellite imagery. The maps were built within the framework of the WALOUS project (Wallonia Land Cover and Use) funded by the PSW and realised by three research units from the Free University of Brussels, the Catholic University of Louvain and the Scientific Institute of Public Service (ISSEP).
The WALOUS maps’ specifications resulted from a large consultation of the regional stakeholders (public administrations, universities, city administrations and some private companies).
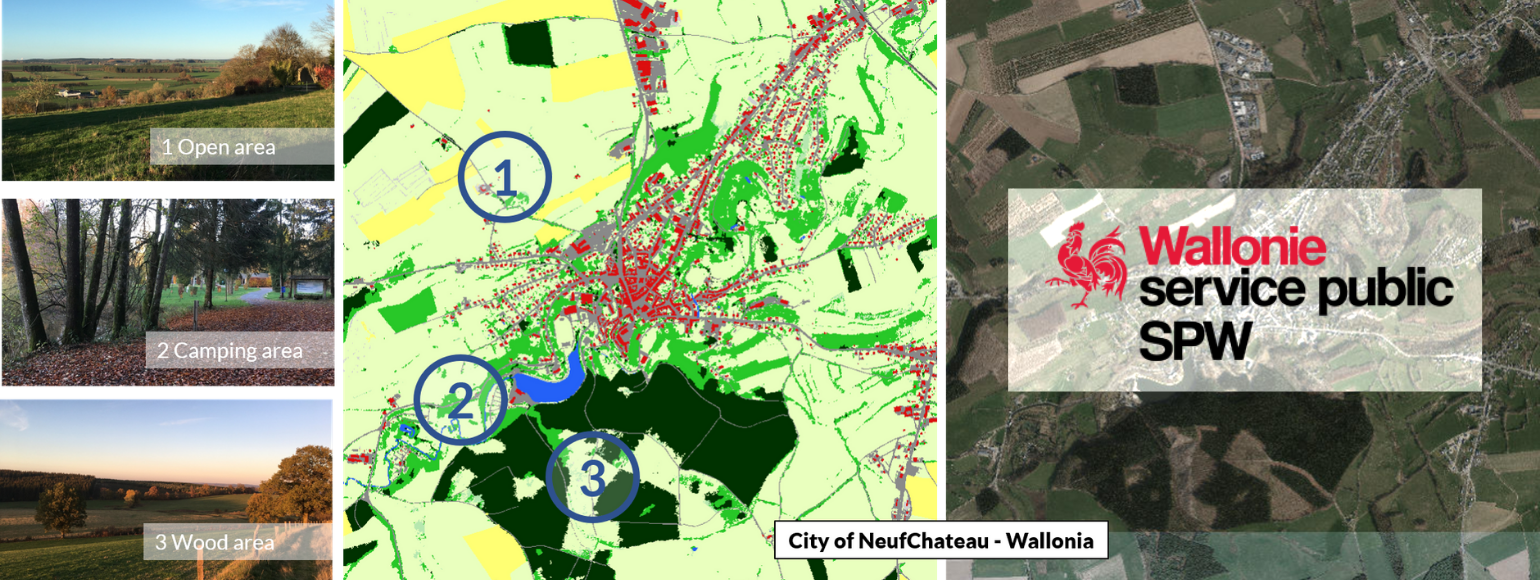
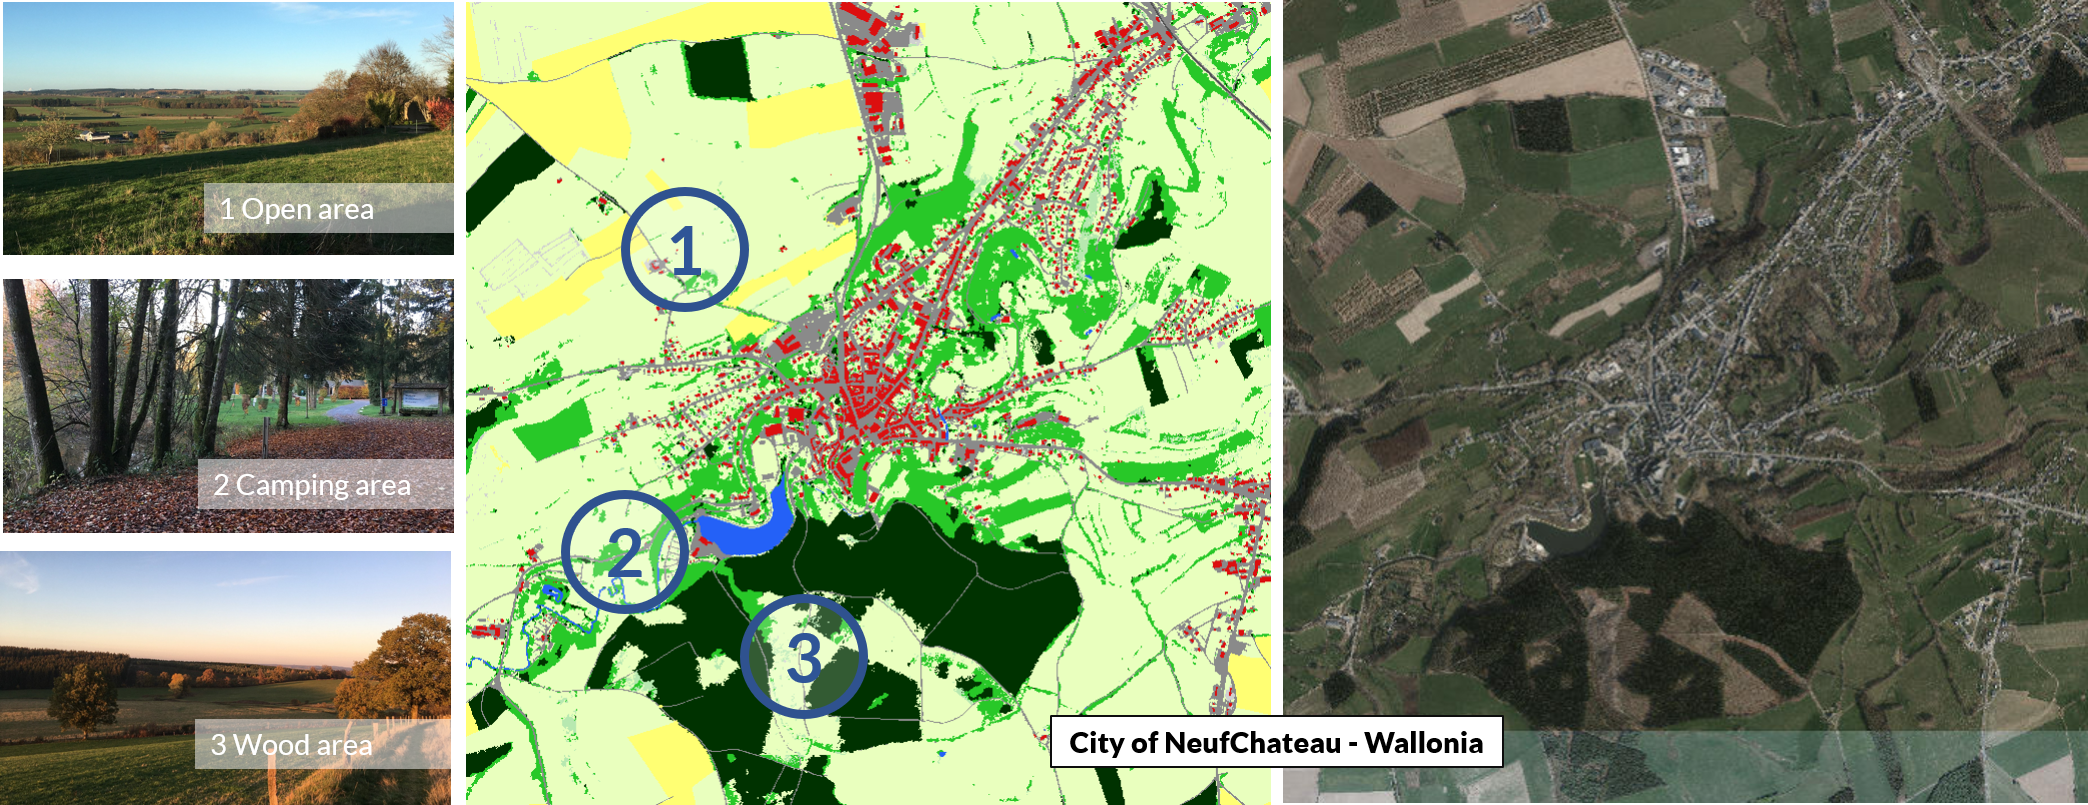
The maps integrate the latest georeferenced data on the whole Walloon territory. Manmade assets, such as buildings and infrastructure, are classified in the WALOUS land use map very precisely by using the sub-metric resolution of orthophotos, digital elevation models and other geodatabases, while vegetation and rural areas are better distinguished thanks to seasonal information from decametric satellite imagery (from the European satellites Sentinel 1 and Sentinel 2). The algorithm producing the final maps integrates all data collected to characterise the different classes.
The benefits
The satellite-based maps produced within WALOUS are made available online and can be consulted by all interested organisations and individuals for free, offering a tool to better understand the regional territory.
View of the Semois river – On the left, the land use map. On the right, the land cover map. (Source: WALOUS storymap: https://geoportail.wallonie.be/walous, Powered by Esri)
The land cover (LC) map highlights the physical and biological coverage of the territory, allowing for the identification of natural features, such as trees, waters, shrubs, and grassland, as well as manmade assets, e.g. buildings, rails, routes, and infrastructure. The LC map provides information that can be used by public administrations and private actors to facilitate decision-making. As an example, the Department of Agriculture, Natural Resources and Environment of the PSW uses the map to support farmers in making their declarations, while the Walloon Air and Climate Agency (AWAC) uses the information to estimate greenhouse gas emissions.
The land use (LU) map details the uses of the regional territory. Indeed, a parcel occupied by trees can correspond to several purposes, for example a residential garden, a recreational area or a natural area. The WALOUS map classifies land uses under different categories: primary, secondary, or tertiary production, transport networks, logistics and public utility networks, residential use, natural areas and other uses. Sub-categories are also available to get more insights into land uses. The land use map is used by the Walloon administrations for several purposes, e.g. to update the regional flood hazard map and assess the potential damage associated with flooding and to manage and monitor the inventory of abandoned sites to be requalified.
According to the user survey, the required update frequency of the maps is every two years, and in 2020 a procurement process was carried out to perform a first update of the map to monitor changes in land cover.
“Combining aerial and satellite information and distinguishing land cover from land use in two different maps changed the use of LULC maps in Wallonia, while allowing the PSW to respond to the EU INSPIRE directive requirements. Moreover, the frequent revisit of input data allows the PSW to plan regular updates of the maps, which is required for statistical and decision-making purposes”. Nathalie Stephenne, Geomatics Department, Public Service of Wallonia
READ THE FULL STORY
Contact details:
Public Service of Wallonia (SPW)
Geomatics Department Namur, Belgium
https://geoportail.wallonie.be/walous