Eurisy Members’ Corner: Focus on the German Aerospace Center

Monitoring Global Urbanisation from Space: The World Settlement Footprint Initiative, 4th November 2022
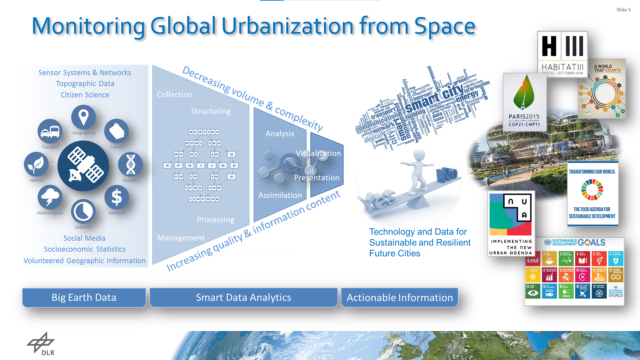
The World Settlement Footprint provides five products that monitor the changing dynamics of urban areas. Such products help policy makers to take informed decisions to make cities more sustainable and resilient to future changes. The WSF combines satellite Earth observation with machine learning and information and telecommunication technologies to provide assessments and predictions, and even to enable participatory platforms to collect and share information on urban settlements.
The 7th episode of the Eurisy Members’ Corner series was conducted by Dr Thomas Esch, Senior Scientist and leader of the “Smart Cities and Spatial Development” team at the German Aerospace Center (DLR).
83% of cities are highly vulnerable to disaster-related mortality and the number of people living in urban areas is constantly increasing. Sustainable and resilient management of our cities is of key importance for our future. The World Settlement Footprint Initiative developed by DLR wants to exploit Earth observation to provide up-to-date and area-wide insights into the status and the dynamics of the built environment.
Sentinel-1 radar and Sentinel-2 multispectral images, open and free, are the core of the WSF information system, that has the ambition of providing free services.
In addition to the information provided daily by satellites, the platform includes data generated by social media and volunteered geographic information, like OpenStreetMap.
Machine learning and artificial intelligence allow scientists at DLR to organise the data collected and to turn it into actionable information for policy makers, scientists and the industry.
The World Settlement Footprint initiative includes five products, or data layers.
The WSF is the first they created in 2015 and updated in 2019, a binary settlement map of the globe indicating where settlements are and how they interrelate with each other. The product is based on Sentinel-1 and Sentinel-2 satellite images. It provides very precise information on the settlements’ extent on the entire Earth.
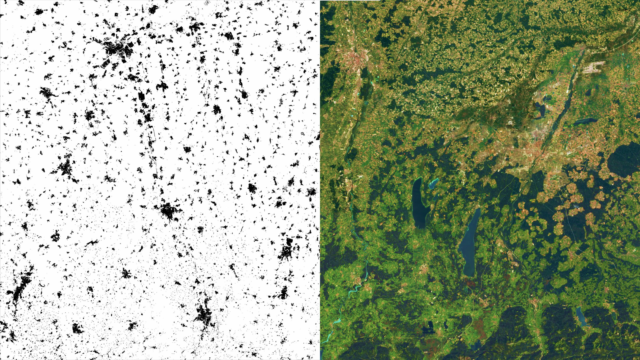
WSF visualisation of settlements in the Bavarian area of Germany based on a Sentinel-2 image and processed by an algorithm.
The second product considers the amount of impervious surface to locate the settlements. Created in 2019, it is based on WSF and Sentinel-2 images and it provides an insight into the density of built areas within cities.
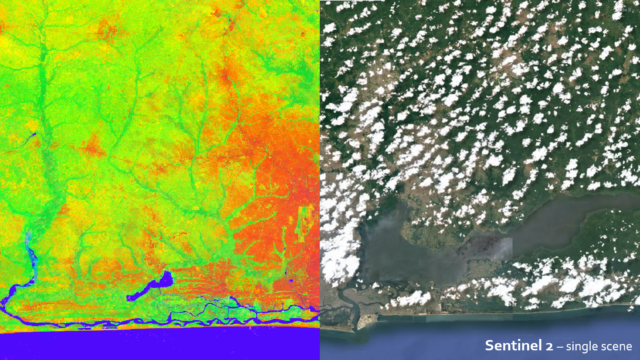
WSF Imperviousness in Laos. Here, different satellite images collected over a period of time have been analysed with the support of machine learning to mask the clouds on the final image. The product shows indexes, like the built-up areas (in red), the vegetation index (in green) and the water index (in blue).
The third product developed by DLR, WSF Population, uses satellite data and statistical data on population to provide information on the distribution of people in a certain area. These products have been used on several occasions by entities such as the World Bank, that asked them to estimate the number of people exposed to natural hazards on the whole African continent.
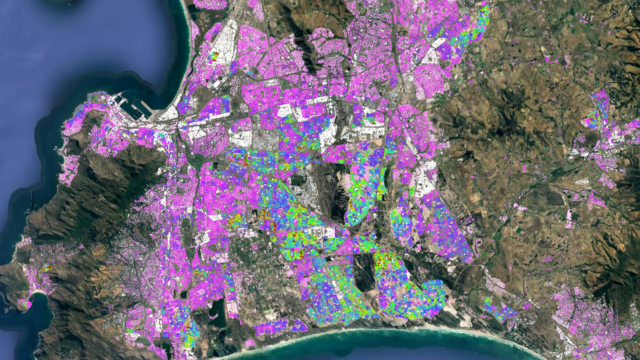
WSF Population showing the distribution of population in Cape Town. White areas are industrial complexes where no population is estimated.
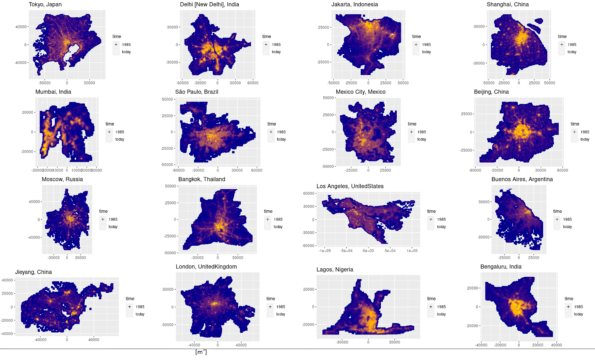
WSF Evolution shows changes of the built-up area and trends over time. Developed in collaboration with Google, the product shows where settlements are growing and how fast.
WSF evolution allows to distinguish planned urban development from more spontaneous urban growth globally. It also allows to measure indicator 11.3.1 “Ratio of land consumption rate to population growth rate” of the Sustainable Development Goal 11 “Make cities and human settlements inclusive, safe, resilient and sustainable”. Indeed, a city is supposed to be more sustainable if the settlements’ growth is higher than the population’s growth.
By combining the data on settlements’ growth coming from WSF evolution with population data provided by the UN, the experts of DLR were able to find out that in cities in low-income countries, settlements grow faster than the population, while in cities in high-income countries, buildings tend to appear at a slower pace than new inhabitants.
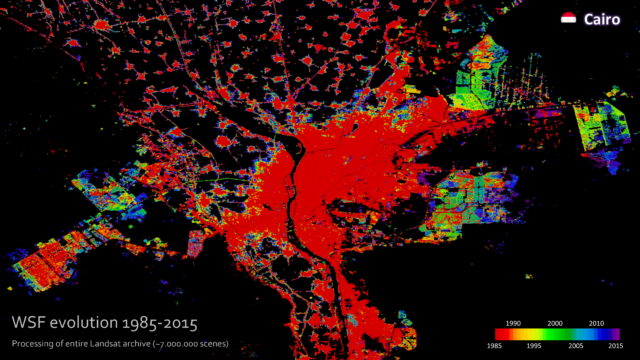
Evolution of settlements’ extent in Cairo from 1985 to 2015 based on Landsat satellite images from that period. The colours — from red (before 1985) to violet (2015) — indicate the years in which the buildings appeared.
The products of the World Settlement Footprint are continuously evolving. Currently, building up on the WSF Evolution, WSF Imperviousness is being fed with Landsat images from 1985 that allow for the assessment of the evolution of the impervious surface over time, while also indicating population density.
In the future, Dr Esch’s team wishes to integrate such analyses with population data, as they did for the International Red Cross in the Gaza Strip, where they mapped the distribution of the population from 2015 to 2020.
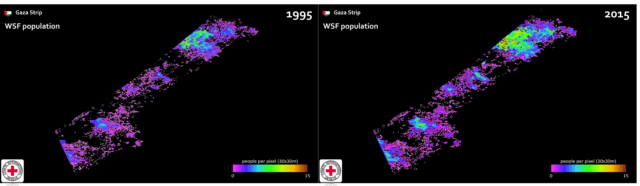
Evolution of impervious surface over population density in Gaza between 1995 and 2015.
Most population modelling activities are still made in 2D. The last product of the WSF initiative, WSF 3D, also includes information on the height of the buildings in the settlements mapped, which allows to estimate population density much more precisely.
The algorithm of the WSF 3D product estimates the location of the centres of cities based on buildings’ volume.
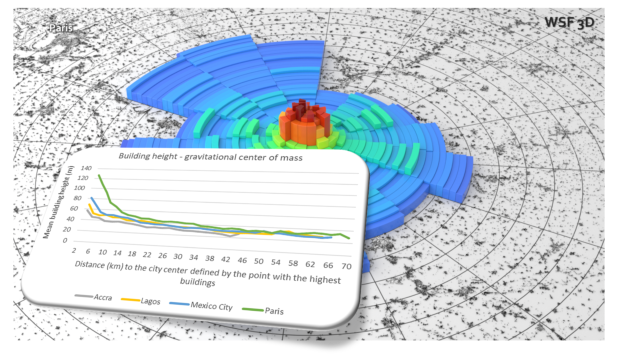
In the main graph: the height of buildings in Paris. Even though it is still not possible to calculate the height of each building, the algorithm of WSF 3D allowed scientists at DLR to find out that cities in high-income countries tend to concentrate high buildings in the city centre, while these are more equally distributed in the neighbourhoods of cities of low-income countries.
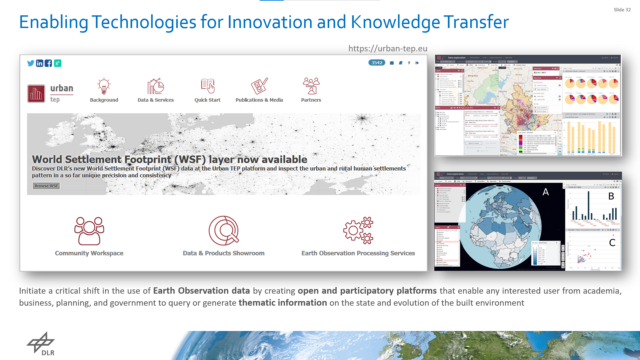
These data have a great potential to support decision making, especially when integrated within thematic applications. Among current activities, DLR is running the Urban Thematic Exploitation Platform project, funded by the European Space Agency. On the platform users can generate information on demand by selecting their area and time of interest. The platform also provides other data, like population data, that can be combined to produce statistics.
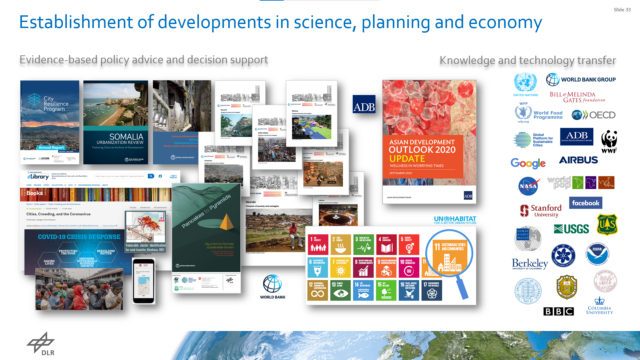
The World Settlement Footprint intiative’s products are largerly used for evidence-based policy advice and decision support (e.g., by the World Bank and the Asian Development Bank) and for knowledge and technology transfer (more than a thousand institutions use the WSF products).
Nevertheless, also local authorities can use such data if they have a geographic information system (GIS). In addition, the WSF can also provide data in the form of statistics or Excel tables that can be used also by municipalise without a GIS. At the moment, the DLR team is also working on technologies to transfer information machine-to-machine for users who can’t store large datasets.
To know more about the activities of DLR visit: https://www.dlr.de/EN/Home/home_node.html
The presentation of the webinar is available here: 20221104_EurisyMembersCorner_DLR-TEsch (2)
The recordings can be accessed here: https://youtu.be/R08Rq6DUAVI
Stay tuned for the next webinar of the Eurisy Members’ Corner that will be hosted by the Netherlands Space Office (NSO) on the 16th of December 2022 between 11:00 AM and 12:00 PM CET.